Draw multi group line chart
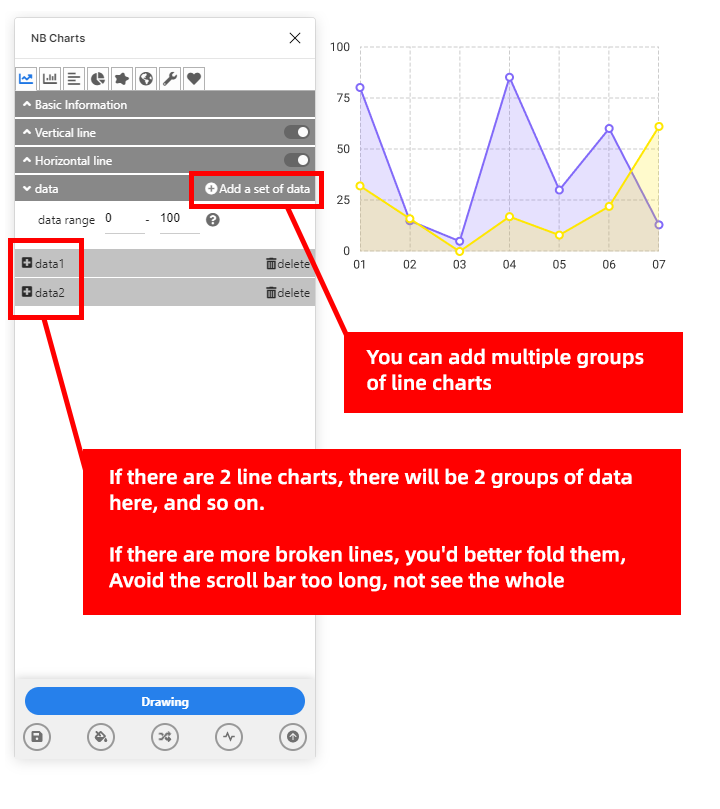
There are multiple groups of broken lines in the chart
Description
If you need to draw multiple lines in a line chart coordinate, you need to click the "add a set of data" button
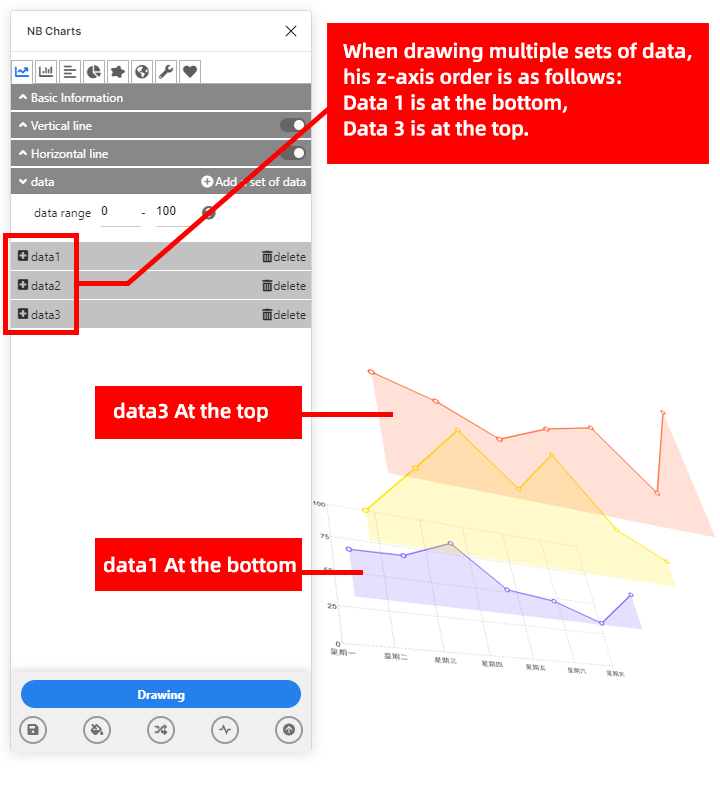
When drawing multiple sets of data, data 1 will be at the bottom of the Z axis, and data n will be at the top.