Bubble text tutorial
Draw a beautiful bubble chart
Description
If you have some knowledge of the JSON data, you can also use "Import JSON" to draw a variety of charts directly.
Drawing step
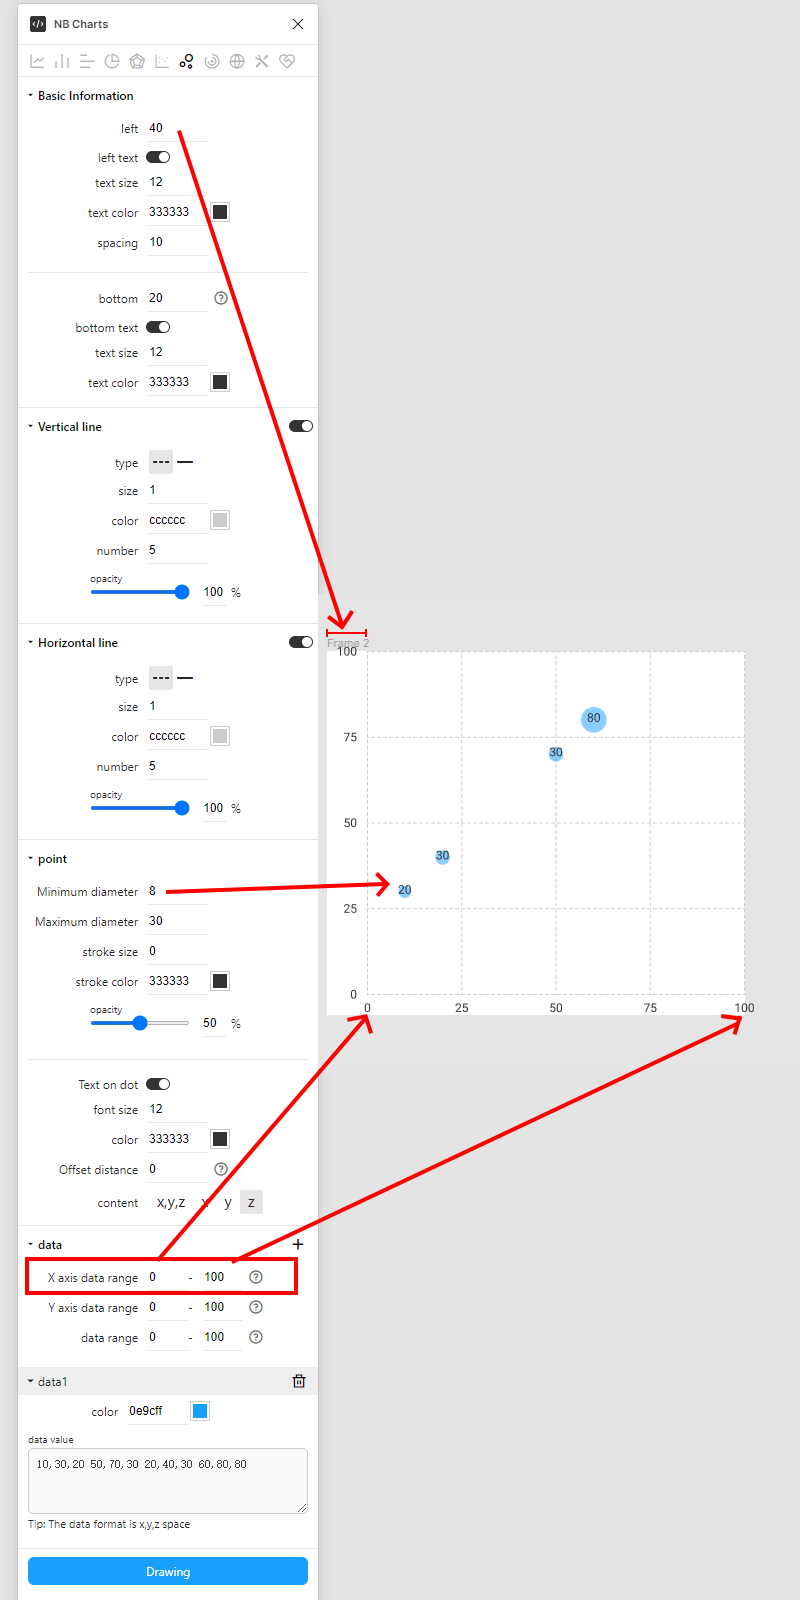
1. Please draw or select an object such as a rectangle.
2. Modify the minimum diameter and maximum diameter of the point.
3. Enter the value of the point, the format is x,y,z. If you need to enter multiple points, separate them with spaces.
4. ClickDrawingbutton, NB Charts will automatically draw the graphics you need.
Interpretation of various parameters