candle text tutorial
Draw a beautiful candle chart
Description
If you have some knowledge of the JSON data, you can also use "Import JSON" to draw a variety of charts directly.
Drawing step
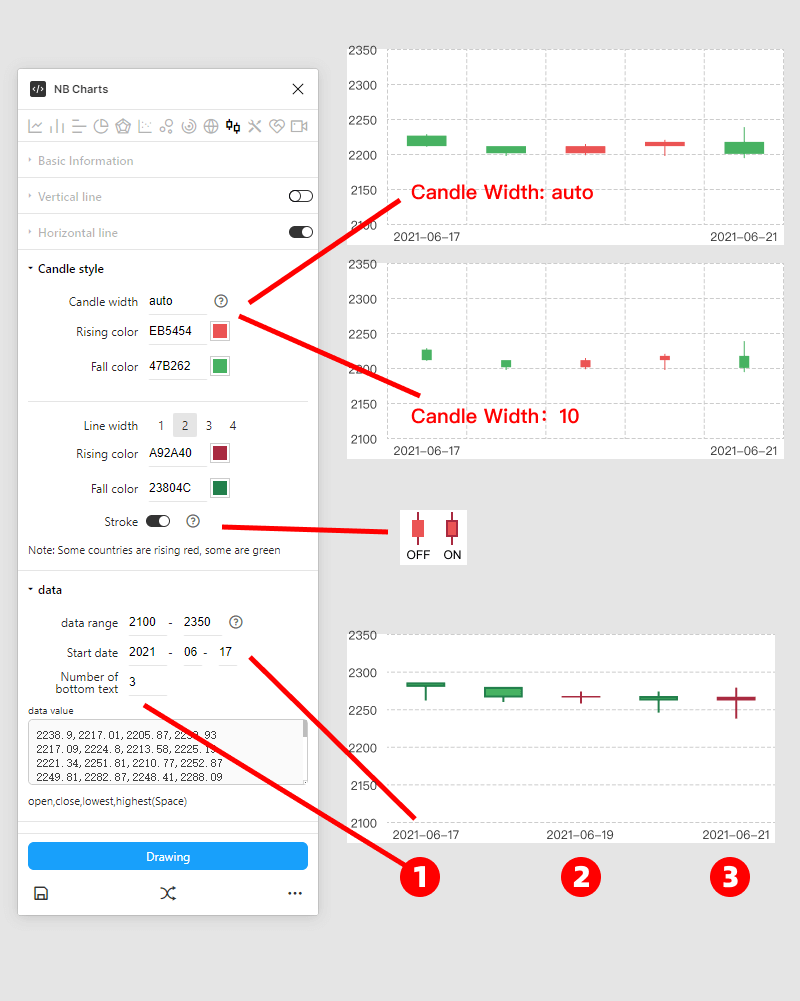
1. Please draw or select an object such as a rectangle.
2. Set the rising color and falling color. Red represents the rise in some countries, and the fall in some countries.
3. Enter the value of each candle. The data format is: opening price, closing price, and lowest price. The two candles are separated by a space.
4. ClickDrawingbutton, NB Charts will automatically draw the graphics you need.
Interpretation of various parameters