candle text tutorial
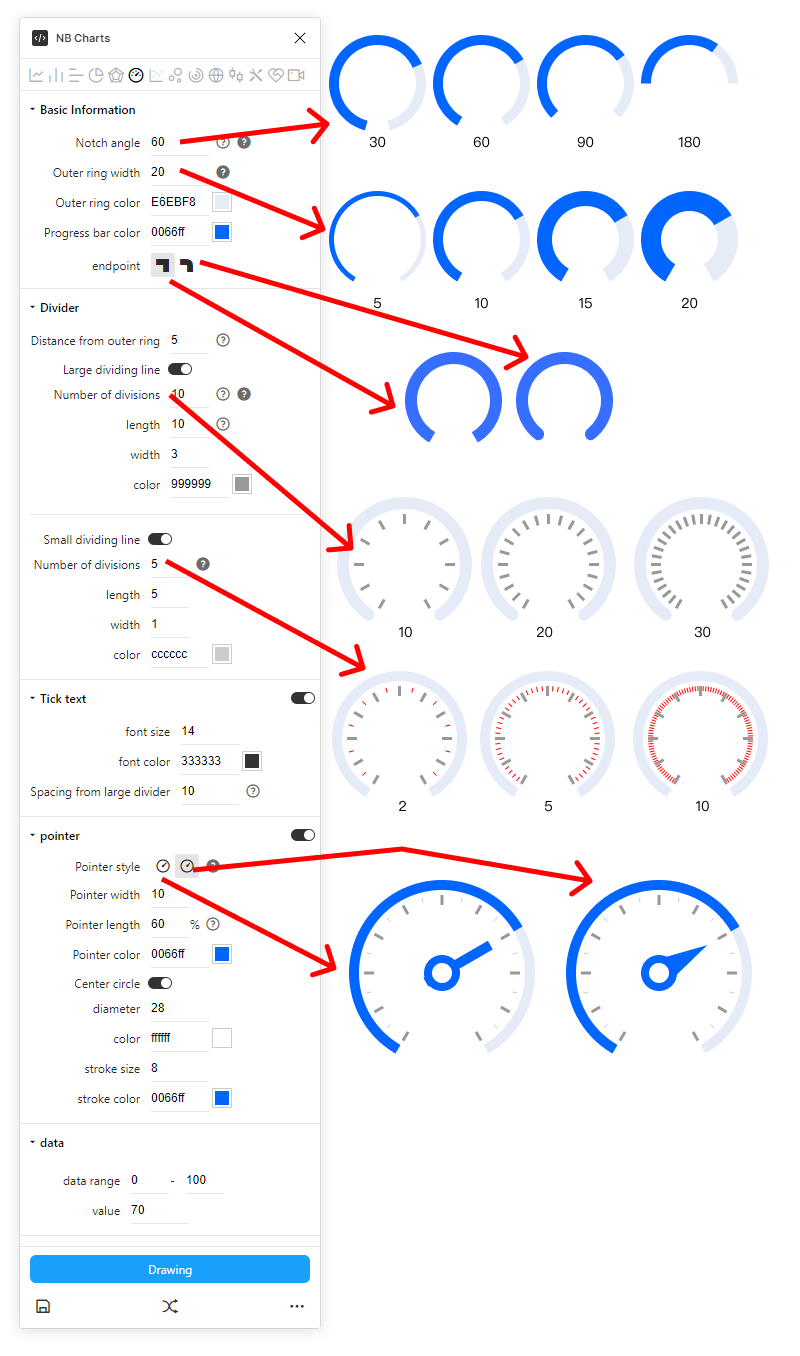
Draw a beautiful gauge
Description
If you have some knowledge of the JSON data, you can also use "Import JSON" to draw a variety of charts directly.
Drawing step
1. Please draw or select an object such as a rectangle.
2. Set the Notch angel, Outer ring width, Number of dividing line...
3. Set data range and value
4. ClickDrawingbutton, NB Charts will automatically draw the graphics you need.
Interpretation of various parameters