Horizontal column text tutorial
Draw a beautiful horizontal column
Description
If you have some knowledge of the JSON data, you can also use "Import JSON" to draw a variety of charts directly.
Drawing step
1. Please draw or select an object such as a rectangle.
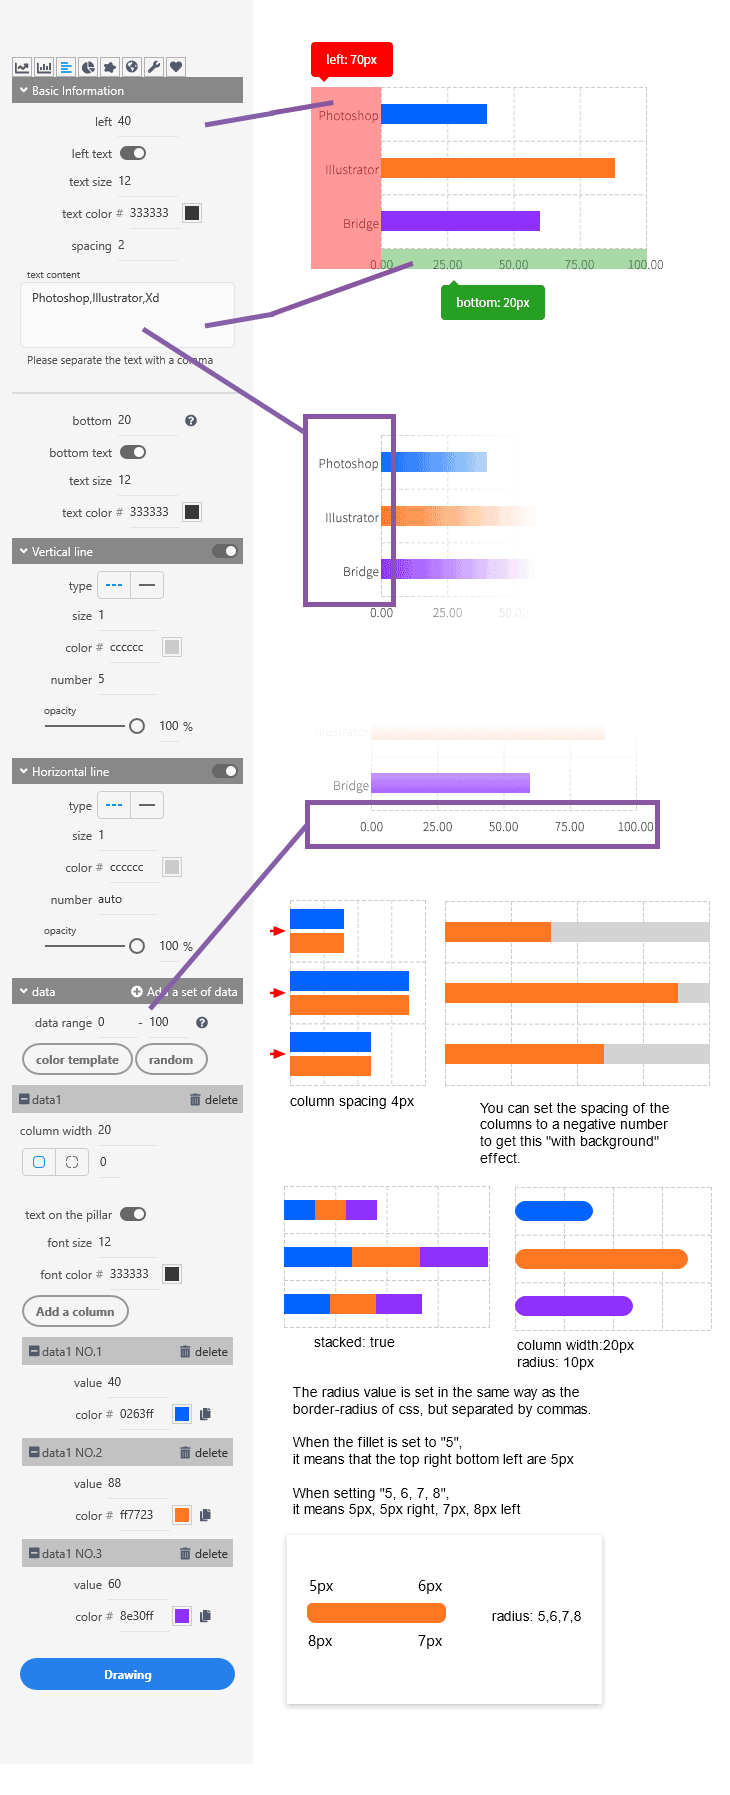
2. Check the content you need to draw, including the horizontal lines, vertical lines, and text of the chart. You can set the column to be monochrome or gradient, or you can set the column to be rounded.
3. If you want, you can add multiple sets of data by clicking the Add a set of data button to create a comparison of multiple columns in each column.
4. ClickDrawingbutton, NB Charts will automatically draw the graphics you need.
Interpretation of various parameters