Ring text tutorial
Draw a beautiful ring chart
Description
If you have some knowledge of the JSON data, you can also use "Import JSON" to draw a variety of charts directly.
Drawing step
1. Please draw or select an object such as a rectangle.
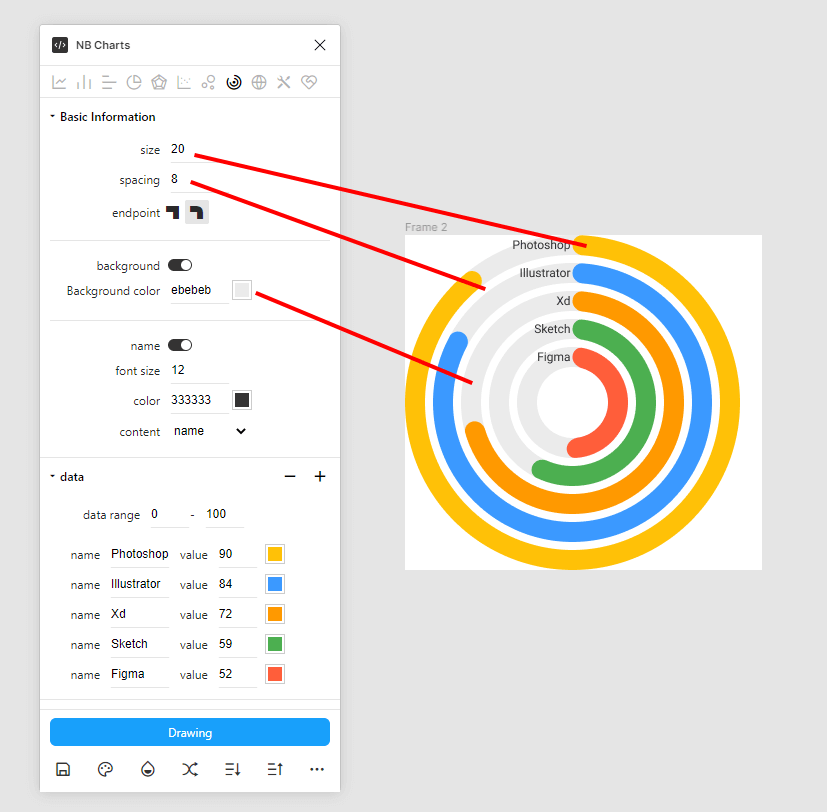
2. Set the width and interval of each ring.
3. According to your needs, set how many rings.
4. ClickDrawingbutton, NB Charts will automatically draw the graphics you need.
Interpretation of various parameters